
💡 Update: Project to build docker tshark-opensearch containers is available here: https://github.com/h21-lab/apps-collection-info
The native tshark JSON and Elasticsearch export enables to push the decoded data into Elasticsearch cluster.
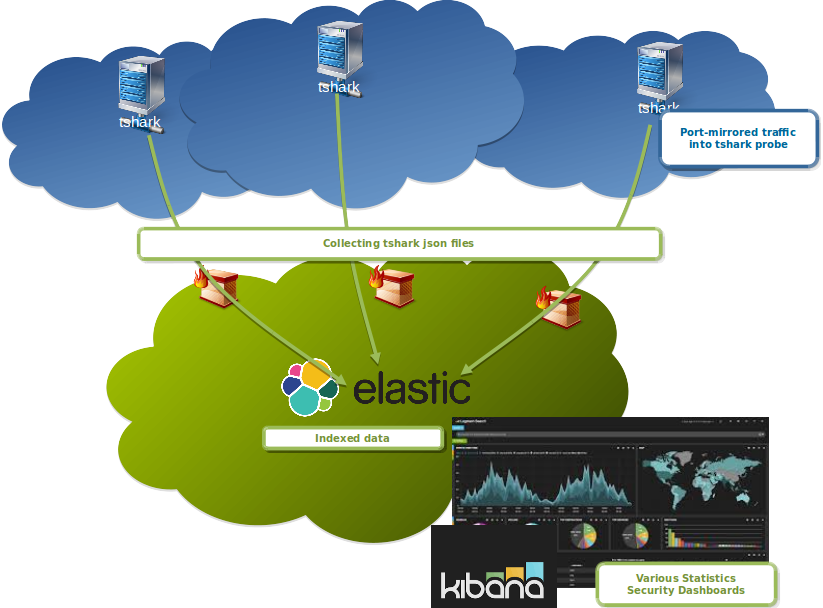
tshark can be used in this way as monitoring probe to push the data into Elasticsearch cluster which enables:
- Indexing of the selected protocol data
- Security dashboards in Kibana
- Free monitoring tool for example for Telecom Operators, SCADA and industry networks (for all protocols which wireshark support)
- Possible further analytic and correlating scripts working on top on Elasticsearch
Possible architecture:
- Multiple tshark probes generating json for Elasticsearch
- Collector downloading over SCP or sFTP the files from tshark probes or directly using HTTP to push data into Elasticsearch
- Post-processing of the data by logstash or by scripts
- Collector pushing data into Elasticsearch cluster
Here is a github project to built VM demonstrating the approach.
Usage
Here is documented short guide how to use it.
Let’s start with documentation:
man tshark (version 3.0.5)
-T  ek|fields|json|jsonraw|pdml|ps|psml|tabs|textSet the format of the output when viewing decoded packet data.  The options are one of:
ek Newline delimited JSON format for bulk import into Elasticsearch.  It can be used with -j or -J including the JSON filter or with -x to include raw hex-encoded packet data.  If -P is specified it will print the packet summary only, with both -P and -V it will print the packet summary and packet details. If neither -P or -V are used it will print the packet details only.  Example of usage to import data into Elasticsearch:
tshark -T ek -j "http tcp ip" -P -V -x -r file.pcap > file.jsoncurl -H "Content-Type: application/x-ndjson" -XPOST http://elasticsearch:9200/_bulk --data-binary "@file.json"
Elastic requires a mapping file to be loaded as template for packets-* index in order to convert wireshark types to elastic types. This file can be auto-generated with the command "tshark-G elastic-mapping". Since the mapping file can be huge, protocols can be selected by using the option --elastic-mapping-filter:
tshark -G elastic-mapping --elastic-mapping-filter ip,udp,dns
fields The values of fields specified with the -e option, in a form specified by the -E option.  For example,
tshark -T fields -E separator=, -E quote=d
would generate comma-separated values (CSV) output suitable for importing into your favorite spreadsheet program.
json JSON file format.  It can be used with -j or -J including the JSON filter or with -x option to include raw hex-encoded packet data.  Example of usage:
tshark -T json -r file.pcaptshark -T json -j "http tcp ip" -x -r file.pcap
jsonraw JSON file format including only raw hex-encoded packet data.  It can be used with -j including or -J the JSON filter option.  Example of usage:
tshark -T jsonraw -r file.pcaptshark -T jsonraw -j "http tcp ip" -x -r file.pcap
...
-j  <protocol match filter>Protocol match filter used for ek|json|jsonraw|pdml output file types.  Parent node containing multiple child nodes is only included, if the name is found in the filter.
Example: tshark -j "ip ip.flags text"
-J  <protocol match filter>Protocol top level filter used for ek|json|jsonraw|pdml output file types.  Parent node containing multiple child nodes is included with all children.
Example: tshark -J "http tcp"
...
--no-duplicate-keys      If -T json is specified, merge duplicate keys in an object into a single key with as value a json array containing all values
NOTE: The -T ek is de-duplicated by default in the latest wireshark code. This is required for Elasticsearch 6.0 and higher due the strict duplicate checking. The use of switch –no-duplicate-keys should be used based on the json parsers. Without this switch, the json generates also duplicated values. This has been described in wireshark bug 12958.
Here follows the examples of generated outputs.
Example of the thsark JSON output (-T json)
# json example by using top-level protocol filter
./tshark -T json -J ip -r siqtran.pcap
[
  {
    "_index": "packets-2017-02-14",
    "_type": "pcap_file",
    "_score": null,
    "_source": {
      "layers": {
        "frame": {
          "filtered": "frame"
        },
        "sll": {
          "filtered": "sll"
        },
        "ip": {
          "ip.version": "4",
          "ip.hdr_len": "20",
          "ip.dsfield": "0x00000000",
          "ip.dsfield_tree": {
            "ip.dsfield.dscp": "0",
            "ip.dsfield.ecn": "0"
          },
          "ip.len": "276",
          "ip.id": "0x00000000",
          "ip.flags": "0x00000000",
          "ip.flags_tree": {
            "ip.flags.rb": "0",
            "ip.flags.df": "0",
            "ip.flags.mf": "0"
          },
          "ip.frag_offset": "0",
          "ip.ttl": "64",
          "ip.proto": "132",
          "ip.checksum": "0x00007ad6",
          "ip.checksum.status": "2",
          "ip.src": "127.0.0.1",
          "ip.addr": "127.0.0.1",
          "ip.src_host": "127.0.0.1",
          "ip.host": "127.0.0.1",
          "ip.dst": "127.0.0.1",
          "ip.addr": "127.0.0.1",
          "ip.dst_host": "127.0.0.1",
          "ip.host": "127.0.0.1",
          "Source GeoIP: Unknown": "",
          "Destination GeoIP: Unknown": ""
        },
        "sctp": {
          "filtered": "sctp"
        },
        "m3ua": {
          "filtered": "m3ua"
        },
        "sccp": {
          "filtered": "sccp"
        },
        "tcap": {
          "filtered": "tcap"
        },
        "gsm_map": {
          "filtered": "gsm_map"
        },
        "gsm_sms": {
          "filtered": "gsm_sms"
        }
      }
    }
  }
]
# json example by using protocol filter
./tshark -T json -j "dns text" -r dns_trace.pcap
[
  {
    "_index": "packets-2016-06-23",
    "_type": "pcap_file",
    "_score": null,
    "_source": {
      "layers": {
        "frame": {
          "filtered": "frame"
        },
        "eth": {
          "filtered": "eth"
        },
        "ip": {
          "filtered": "ip"
        },
        "udp": {
          "filtered": "udp"
        },
        "dns": {
          "dns.id": "0x0000a77c",
          "dns.flags": {
            "filtered": "dns_flags"
          },
          "dns.count.queries": "1",
          "dns.count.answers": "0",
          "dns.count.auth_rr": "0",
          "dns.count.add_rr": "0",
          "Queries": {
            "clients6.google.com: type A, class IN": {
              "dns.qry.name": "clients6.google.com",
              "dns.qry.name.len": "19",
              "dns.count.labels": "3",
              "dns.qry.type": "1",
              "dns.qry.class": "0x00000001"
            }
          }
        }
      }
    }
  }
]
# json example of the fields filter
./tshark -T json -e "ip.dst" -e "ip.src" -r /test_http.pcap
[
  {
    "_index": "packets-2016-06-30",
    "_type": "pcap_file",
    "_score": null,
    "_source": {
      "layers": {
        "ip.dst": ["10.0.0.1"],
        "ip.src": ["10.0.0.2"]
      }
    }
  }
]
Example of Elasticsearch output (-T ek)
# by using json protocol filter
./tshark -T ek -j "dns text" -r dns_trace.pcap
{"index" : {"_index": "packets-2016-06-23", "_type": "pcap_file", "_score": null}}
{"timestamp" : "1439587238915", "layers" : {"frame": {"filtered": "frame"},"eth": {"filtered": "eth"},"ip": {"filtered": "ip"},"udp": {"filtered": "udp"},"dns": {"dns_dns_id": "0x0000a77c","dns_dns_flags": "","filtered": "dns_flags","dns_dns_count_queries": "1","dns_dns_count_answers": "0","dns_dns_count_auth_rr": "0","dns_dns_count_add_rr": "0","dns_text": "Queries","text_text": "clients6.google.com: type A, class IN","text_dns_qry_name": "clients6.google.com","text_dns_qry_name_len": "19","text_dns_count_labels": "3","text_dns_qry_type": "1","text_dns_qry_class": "0x00000001"}}}
# by using the fields filter
./tshark -T ek -e "ip.dst" -e "ip.src" -r /test_http.pcap
{"index" : {"_index": "packets-2016-06-30", "_type": "pcap_file", "_score": null}}
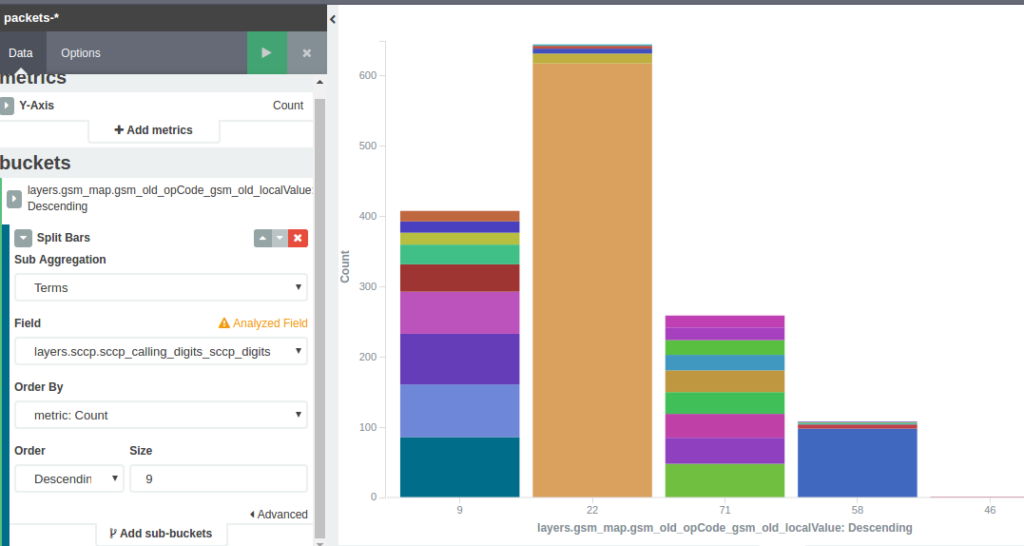
{"timestamp" : "1438233730468", "layers" : {"ip_dst": ["10.0.0.1"],"ip_src": ["10.0.0.2"]}}Example of Kibana dashboards
GSM MAP split by Operation Codes and Calling GT
To store the whole packets into Elasticsearch, the following could be used.
However for more complex operations logstash should be considered.
./tshark -T ek -x -r ~/e/_Downloads/test_dns.pcap > ~/Downloads/file.json
curl -H "Content-Type: application/x-ndjson" -XPOST http://elasticsearch:9200/_bulk --data-binary @file.json

To reconstruct the pcap back from Elasticsearch
# past the frame_raw into text file using vi editor
vi test.hex
xxd -r -p test.hex | od -Ax -tx1 | text2pcap - test.pcap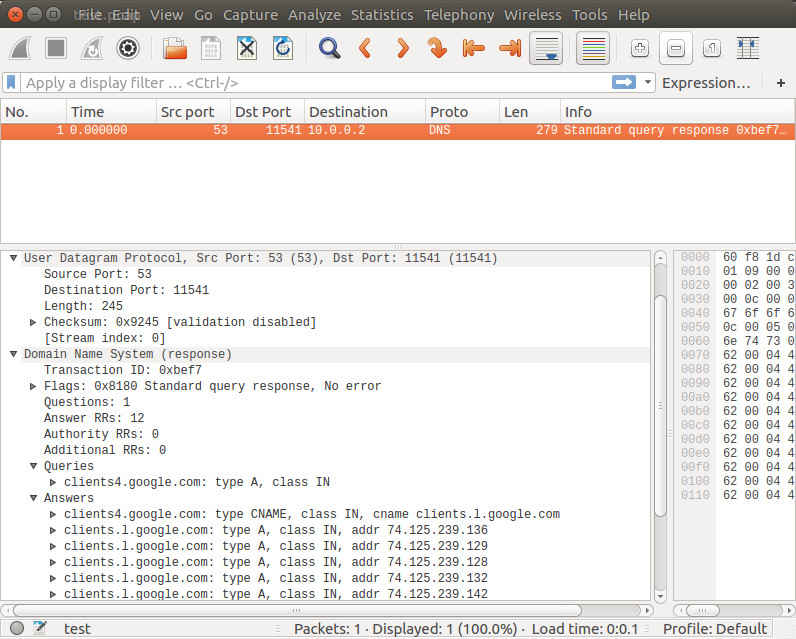
REFERENCES and UPDATES:
- 31.12.2015: Similar functionality provided project https://vichargrave.github.io/programming/packet-capture-with-pyshark-and-elasticsearch/ but the tshark should provide better performance.
- 19.6.2016: tshark + Elasticsrach wireshark patch contributed
- 16.8.2017: Blog by Christoph Wurm from Elastic – Analyzing Network Packets with Wireshark, Elasticsearch, and Kibana
- 31.10.2017: tshark –no-duplicate-keys switch is now included in master wireshark branch. Elasticsearch json (-T ek) output is deduplicated by default now, required by Elasticsearch 6.0 which forces strict duplicate checking. Patch submitted by Christoph Wurm from Elastic.
- 22.12.2017: Architectural Proposal for the Handling of Network Operations Data with Specific Focus on Virtualized Networks by NGMN Alliance
- 15.2.2019: Starting with Wireshark 3.0.0rc1, TShark can generate an Elasticsearch mapping file by using the -G elastic-mapping option (see Analyzing Network Packets with Wireshark, Elasticsearch, and Kibana)
- 17.4.2019: Espcap is python program that uses tshark to capture packets live from a network interface or from PCAP files and index them in Elasticsearch. https://vichargrave.github.io/programming/packet-capture-with-wireshark-and-elasticsearch/, https://github.com/vichargrave/espcap
- 8.10.2019: Added tshark + Elasticsearch in Docker article
- 26.5.2020: Added project to build virtual machine https://github.com/H21lab/tsharkVM
- 9.6.2021: tshark + ELK: Network Traffic Monitoring and Analysis – BlackHat USA 2021 arsenal